2024 Polkadot Treasury Report
-c3c3a1c14f0cb3891c1234dd3b833d7e.png)
Introduction
This is the 2024 Polkadot Treasury Report. It concludes the 2024 Treasury Report series and is an important tool for informing Polkadot stakeholders.
Polkadot OpenGov is the governance mechanism of the Polkadot DAO. Its Treasury is multi-asset and multi-chain: Hundreds of voters trustlessly oversee a portfolio of 200m USD in DOT and stablecoin assets on 7 different chains. The Polkadot DAO operates over 20 departments that cover all areas of ecosystem functions, making Polkadot a fully autonomous Web3 ecosystem.
-b8d6d73d5c3ddf982ae9fdc253e5f8f0.png)
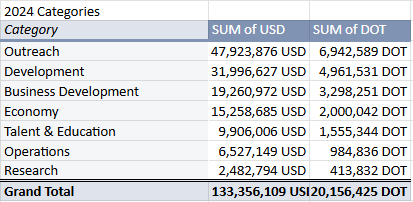
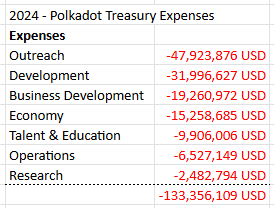
In 2024, Polkadot spent 133m USD across the full spectrum of organizational functions. It does not rely on central planning, but rather on bottom-up projects presented for approval to stakeholders. This report breaks down spending into 7 categories, highlighting the DAO’s focus on research & development, outreach, growing the economy and talent pool, business development, and network operations.
Strategic Initiatives
To help newcomers to Polkadot read this report, we want to begin by offering a few ideas that guide the decision-making of many voters. DAO contributors (”agents”) ensure that the Treasury aligns on strategic initiatives:
- As the guiding strategic principle, Polkadot is committing to the core vision of Web3: Apps that put users back in control of the Internet! Its ecosystem has to be understood as the Polkadot Cloud. A complete stack of Web3 services that allow builders to create powerful and scalable applications and business cases at a fraction of the cost of other ecosystems.
- Polkadot is unstoppable. It sustains itself. Research, development, and operations all focus on delivering secure and resilient core Web3 infrastructure. Bridges, wallets, data services, SDKs, governance and developer tooling, and nodes are all paid for by OpenGov. As a result, the network is not dependent on external organizations.
- Polkadot’s growth thesis is centered on enterprise adoption in key verticals. Its business development and market operations are focused on winning market share in (1) DeFi, RWA & Fintech, (2) Gaming & Entertainment, (3) AI & DePin, (4) Social and Identity, and (5) GovTech. Decentralized business development teams work with investors, accelerators, and ecosystem support teams to help teams onboard and succeed in Polkadot.
- Polkadot is developing its talent pool. The Polkadot Blockchain Academy provides multi-week in-person education to hundreds of founders and developers multiple times per year to provide new projects with qualified personnel. In addition, hackathons around the globe expose thousands of devs each year to Polkadot’s tech stack.
- Polkadot’s outreach effort is unmatched by any other DAO. From content creation in Polkadot-native media brands to distribution, to advertising. From market research to running a decentralized ambassador program and hosting and participating in global events. All of these functions are now operated by the DAO, removing the risks of single points of failure.
- OpenGov is differentiating into specialized departments, scaling up its throughput capacity. Dedicated departments composed of domain experts are forming around key ecosystem functions (e.g. marketing, FinTech integrations, etc) to streamline the processing of related proposals. This reduces the load on the main OpenGov voting tracks and allows stakeholders to focus on high-level decisions.
Key Insights
- The Balance Sheet shows 211m USD (31.2m DOT). On the asset side…
- 157m USD (23.4m DOT) are free for spending. 11.6m USD of the cash reserves are available as stablecoins, with an additional 4m DOT (26m USD) allocated to automated stablecoin acquisition.
- 41.6m USD (6.1m DOT) are earmarked for strategic initiatives such as marketing, DeFi tooling, gaming, BD, etc.
- 12m USD (1.8m DOT) are deployed into DeFi market operations.
- Expenses
- The Treasury has spent 133m USD (19.9m DOT) in 2024. Accounting for inflation and burn, the total net loss is 15m DOT.
- The top 3 spending categories are Outreach (48m USD), Development (32m USD), and Business Development (19m USD)
- Departments (Bounties and Collectives)
- 19% (25m USD, 3.8m DOT) of the spending happened via departments
- The DAO started adding stablecoins to its portfolio in H2. It acquired 32m USD in stables, of which it spent 17m USD.
- OpenGov is deploying capital into the economy:
- 15m USD (2m DOT) have been given out as DeFi incentives
- 12m USD (1.8m DOT) are provided as liquidity into 4 different DeFi protocols
- Inflation has been changed to provide a future stable income of 18m DOT per year to the Treasury, paving the way for more predictable budgeting.
- Polkadot has 10 years’ worth of reserves. Thanks to the recently changed inflation model, the Treasury’s long-term perspective has become very stable.
About this Report
Serious Web3 ecosystems that manage millions of USD in assets should consider established accounting best practices. The report comes with a balance sheet and income statement. The balance sheet will give a complete overview of all active accounts the Treasury manages and how assets are distributed over its operations. The income statement will break down the categories in which the Treasury spends.
We can now look back on the first full year of Treasury reporting, giving us the necessary baseline to make the first budget projections for the future and compare future years against our baseline.
We express our gratitude to the Web3 Foundation for funding this report as part of the **OpenGov.Watch** initiative. Thanks also to the OpenSquare team for providing an API to fetch spending data via their dotreasury.com project, as well as the Parity data team for providing additional data.
Authors: Alice und Bob, Jeeper
Balance Sheet
Assets
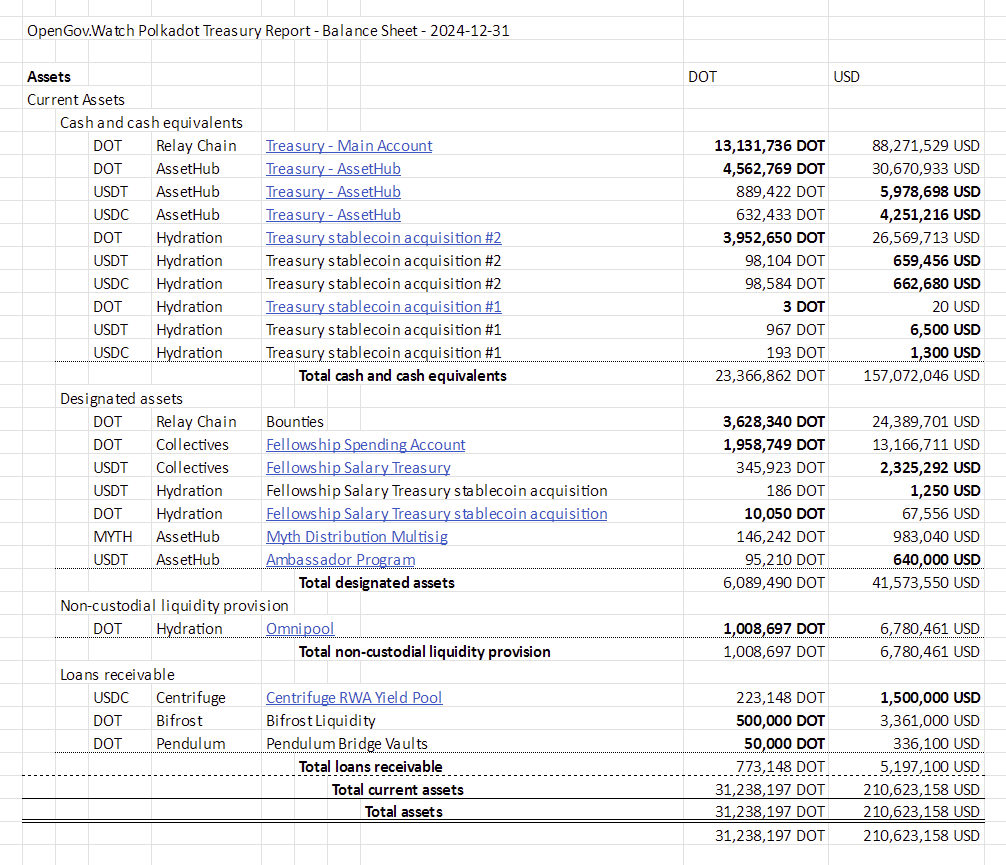
The balance of the Polkadot DAO at the end of 2024 comes out at 31.2m DOT / 211m USD.
Let’s break down some general stats before we dive into the specific categories.
General Stats 🫡
Polkadot Treasury Asset Portfolio
-6f2ffcba7f502f68181b18b55267abcb.png)
The Treasury holds DOT, USDT, USDC, and MYTH. The Treasury’s biggest position is in its native asset DOT, with 28.8m DOT (194m USD) making up 92% of the portfolio. The stablecoin portion of the Treasury is 4.7% USDT (9.9m USD) and 3% USDC (6.4m USD). MYTH about to be airdropped makes up 0.5% (1m USD).
Polkadot Treasury Assets by Chain
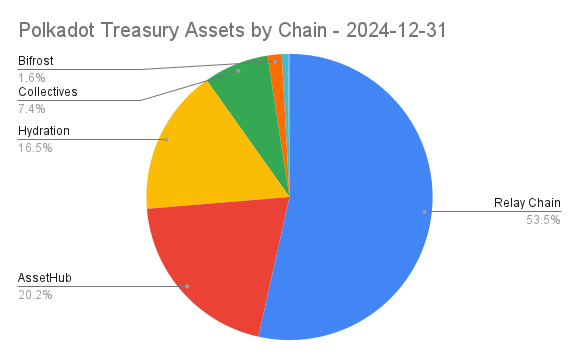
Polkadot holds assets on 7 different chains. Parachains have become a significant part of the Treasury economy, with 19% of the Treasury’s owned assets being deployed on various DeFi chains like Hydration (34.7m USD), Centrifuge (1.5m USD), Bifrost (3.3m USD), and Pendulum (336k USD). Polkadot Governance allows decisions to be executed trustlessly across all chains under the Polkadot security umbrella. 81% of the Treasury is held on 3 system chains to be used as free cash and for the various executive bodies.
Asset Categories
-80229331906bd85748872025b60dffc4.png)
For the balance sheet, we have categorized assets as follows:
- Cash and cash equivalents: 23m DOT / 157m USD
- Designated assets: 6.1m DOT / 42m USD
- Non-custodial liquidity provision: 1m DOT / 6.8m USD
- Loans receivable: 770k DOT / 5.2m USD
Cash and Cash Equivalents (23m DOT / 157m USD)
This category consists of DOT, USDT, and USDC which are immediately or very quickly available for the Treasury's use. Cash is held on the relay chain and AssetHub system chain.
- Relay Chain: 13.1m DOT (88m USD)
- AssetHub:
- 4.6m DOT (31m USD)
- 6m USDT (890k DOT)
- 4.3m USDC (630k DOT)
In addition, a trustless and fully automated stablecoin acquisition campaign has successfully concluded, while another one is still running on the Hydration DeFi chain
- Stablecoin acquisition campaign #1 concluded at the end of 2024.
- Stablecoin acquisition campaign #2 still has about 4m DOT (26m USD) to be swapped until 2025-Q3
Designated Assets (6.1m DOT / 42m USD)
Designated assets are assets that are under the control of OpenGov, but are already earmarked for specific jobs, primarily to fund its executive bodies (bounties and collectives). In addition, Polkadot holds 1m USD in MYTH to be deployed through airdrops to DOT holders.
Bounties
Polkadot has 24.4m USD (3.6m DOT) sitting in bounties, ready to be distributed to teams that perform value-adding activities in the ecosystem. (To learn more, book a free consultation here)
Technical Fellowship
The Polkadot Technical Fellowship is the core maintainer of the runtime. They are funded through the DAO. They have two accounts:
- Salary account: 2.3m USDT (350k DOT)
- Spending account: 2m DOT (13.2m USD)
In addition, they also trustlessly acquire USDT through Hydration, with about 10k DOT (68k USD) still about **to be swapped.**
MYTH Airdrop
As part of Polkadot’s strategic partnership with Mythical, it acquired MYTH tokens in exchange for 1m DOT. 2.5m USD-equivalent of MYTH were already distributed to DOT holders. A remaining reserve of 1m USD-equivalent MYTH remains within the MYTH distribution account to be used in the future.
Non-Custodial Liquidity Provision (1m DOT / 6.8m USD)
The Treasury deploys some of its idle capital into the Polkadot economy. 1m DOT (6.8m USD) sits in the Hydration Omnipool as DOT liquidity.
Loans Receivable (770k DOT / 5.2m USD)
These positions are the custodial counterparts of non-custodial liquidity provision.
- 1.5m USDT has been deployed to Centrifuge RWA Yield Pool
- Bifrost has deployed 500k DOT into its liquid staked DOT product
- Pendulum has borrowed 50k DOT for its stablecoin bridge vaults
Liabilities and Treasury Balance
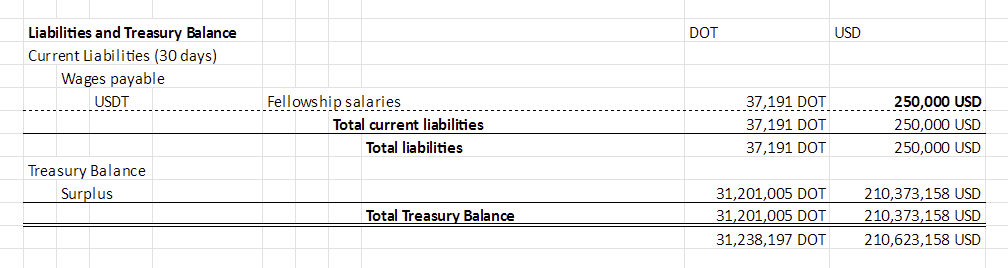
Liabilities are simple in Polkadot.
- Wages Payable for the Technical Fellowship come out at a maximum of 250k USD per 28-day cycle.
Comparing liabilities against assets, the Polkadot Treasury comes out with a surplus of 31.2m DOT (210m USD).
Income Statement
For the income statement, we use DOT as the primary unit of account, since it is the unit that the Treasury income, inflation, is based on. For the expenses section, we will additionally provide a USD-denominated table, since expenses are part of the income statement that is also relevant to understand in stable terms.

Polkadot has had expenses of 20.1m DOT (133m USD) in 2024. After adding revenue, inflation, and burn, the net loss was 15m DOT.
Expenses
-b8d6d73d5c3ddf982ae9fdc253e5f8f0.png)
Polkadot spent 133m USD in 2024. The biggest cost driver is outreach, leading with 48m USD. Development of new software came next with 32m USD. Business Development Initiatives totaled 19m USD. 15m USD were spent as incentives for the economy. For growing and educating talent, Polkadot spent 9.9m USD. Operating the network infra cost 6.5m USD. 2.5m USD was spent on research.
We will dig into the details below, but before we do so, let’s look at what categories Polkadot spends money on.
Categories
The categories and subcategories in this report have been selected by our team:
- Research: Security, Governance, Anti-Scam efforts, reports, and analytics, UX & DX
- Development: The Polkadot protocol and its core SDKs, Bridges, Wallets, data services & indexers, SDKs, Governance tooling smart contracts, and various other technologies
- Operations: software, hardware, and service costs incurred to operate the network (RPCs, archive nodes), auxiliary services (explorers, indexers), and legal costs (foundations)
- Outreach (Marketing, BD, Community Development): Marketing (media production, PR, advertising) and community development (conference hosting, conference attendance, local outreach, events, community building, ambassador program)
- Business development: developing verticals like gaming, DeFi integrations, GovTech, music industry solutions, consulting, solution architecture, DevRel
- Talent & Education: education, hackathons, recruiting, and talent incubation through the Polkadot Blockchain Academy
- Economy: Liquidity Incentives to stimulate the economy
Spending Overview
Since the introduction of OpenGov in the middle of 2023, we saw a continual rise in spending until a reversal happened in July 2024. The highest spending quarter in 2024 was Q2 with 58m USD, while in Q4 only 13m USD was spent. Costs for the smallest 3 categories (Operations, Talent & Education, and Research) as well as Development were fairly stable, while Outreach, Business Development, and Economy were more elastic.
Outreach continually rose until Q2, leading to a 25m USD spend in a single quarter. In addition, a one-time spend of 2m DOT on DeFi incentives led to Q2 being the most costly quarter in 2024. Given that this rate of spending was not sustainable, stakeholders put on the brakes and scaled down spending for the rest of the year.
Now let’s dive a bit into the individual categories!
Outreach
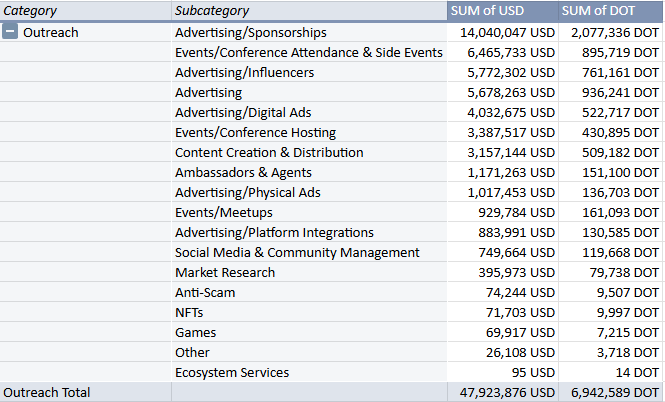
48m USD was spent on outreach for marketing and community building**.** The Outreach category is the biggest and most complex. It contains not only subcategories but also sub-subcategories. The most relevant clusters are around advertising and events. We will start by looking at them individually.
Advertising
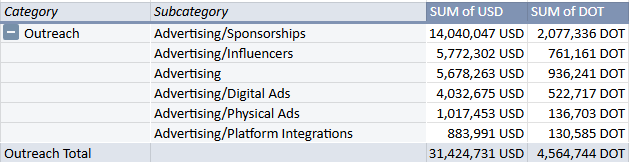
Advertising in total made up 31m USD. The 3 big Sponsorships (14m USD) were Inter Miami (10.7m USD), Conor Daly (1.9m USD), and HEROIC (1.4m USD). Various advertising and influencer services (10.8m USD) were performed by EVOX (4.3m USD), Pineta Digital (2.3m USD), Lunar Strategy (2m USD), and MarketAcross (530k USD). The Treasury also funded the advertising of a DOT Virtune ETP (590k USD). Digital Advertising (4m USD) was spent on a CoinMarketCap integration (1m USD), DED memecoin marketing (670k USD), and awareness in The Block (450k USD) and Brave Browser (390k USD). Some of the most impactful campaigns involved Physical Ads (1m USD), such as in Canary Wharf, London (260k USD), Lyft Taxis in NYC (230k USD), and Changi Airport in Singapore (220k USD). Lastly, Polkadot paid 880k USD for platform integrations, such as 450 for a games integration and 320k USD for a Cointelegraph partnership.
Events
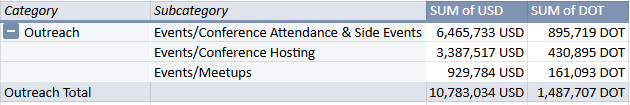
Polkadot spent 10.8m USD on events. The biggest position here is conference attendance & side events (6.5m USD), ensuring that Polkadot is represented at major events, such as Radio Intereconomia & BDZ (560k USD), Polkadot Decoded Asia at Token 2049 Singapore (540k USD), and the ETHDenver afterparty (420k USD). Hosting conferences has cost 3.4m USD with Decoded 2024 costing 2.5m USD, and Sub0 2023 (450k USD) and Sub0 2024 (440k USD) costing a fifth of that. Meetups (930k USD) has mostly small positions, with the larger ones being a withdrawal of 50k DOT (225k USD) as a volatility buffer for the Events Bounty multisig, 98k USD for an Exiled Racers event in NYC, and 46k USD for an Apillon event.
Other Outreach
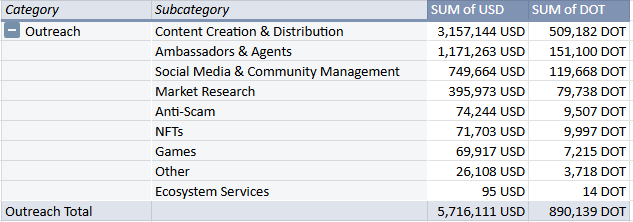
Other Outreach (5.7m USD) related activities are led by Content Creation & Distribution (3.2m USD). This includes a full year of The Kus (530k USD), WagMedia (450k USD), Behind the Code Season 2 (350k USD), and many other content creators. Ambassadors & Agents (1.2m USD) covered the founding of the Ambassador Program (640k USD), the Agents Program (360k USD), and recognition of various other communities and individuals. Social Media & Community Management (750k USD) covered operating social media and community channels such as the Main X channels in Spanish (340k USD) and English (150k USD) and the moderation team (230k USD). Market Research (400k USD) funded two projects. Community Building (1.2m USD) included Southeast Asia Community Expansion (380k USD), the Spanish Social Media Account (240k USD), and the Englisch Social Media account (150k USD). Polkadot is also now ramping up its Ambassador program (720k USD) and investing in research and user segmentation (400k) as well as some smaller outreach activities.
Development
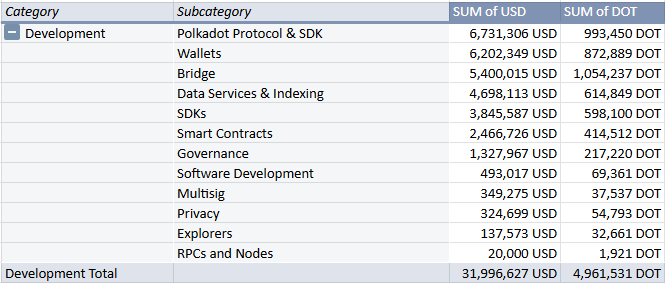
Development (32m USD) covers software development specifically for the core Polkadot infrastructure and tools necessary to operate and interact with the network. Polkadot Protocol & SDK (6.7m USD) covers software to run Polkadot and its chains itself. The biggest positions here are the Gossamer (2.8m USD) and Kagome (800k USD) implementations, Rust Runtime verification (540k USD), and XCQ (310k USD). Salaries for the Technical Fellowship totaled 700k USD. Wallet development (6.2m USD) was split between Subwallet (2.5m USD), Talisman (1.5m USD), and Nova (1.2m USD). Snowbridge development was funded with 5.4m USD. Data Services and Indexing (4.7m USD) brought Polkadot data to Dune (2.5m USD), Token Terminal (1.4m USD), and Artemis Analytics (200k USD).
SDKs (3.8m USD) cover various libraries building on top of Polkadot chains. Apillon SDK received 1.6m USD, the Polkadot-API 1.2m USD, while retroactive funding for ORML, Chopsticks, and Subway came out at 720k USD. Growing smart contract capabilities (2.5m USD) is another priority of the DAO, with 1.5m USD going towards various ink! projects like Pop Network (560k USD), and 420k USD for the EVM-based Magnet chain. Ecosystem Services (2.4m USD) covers code audits through BlockDeep Labs (570k USD) and security audits through the Polkadot Assurance Legion (1.8m USD).
Governance tools (1.3m USD) include Subsquare (760k USD) and Polkassembly (200k USD) subsidies and tooling like a bounty manager UI (170k USD) and the Discord voting bot (140k USD). Various other projects make up 1.3m USD.
Business Development
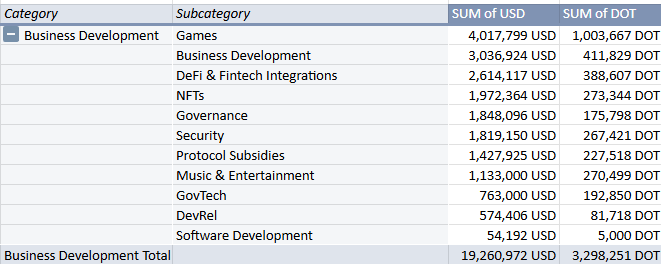
Business Development (19.3m USD) efforts focused on market penetration of several verticals and DevRel-related activities, as well as funding niche-specific tech and experiments.
Games (4m USD) is led by a 2.3m USD MYTH airdrop to onboard active Polkadot users to the Mythical gaming ecosystem and set up the Mythos Foundation (266k USD). The Gaming Bounty spent 1.4m USD on strategic initiatives in the gaming industry. The Business Development subcategory (3m USD) was mainly used for general BD activities and deepening relationships with institutions and governments. On top we have a partnership with The Tie (1m USD), hiring professional business developers with Missing Link (540k USD), and numerous local initiatives.
DeFi & Fintech integrations (2.6m USD) lays the financial rails for Polkadot, led by the RWA issuer Avata (550k USD), non-custodial payment gateway Kalatori (330k USD), and remittance service LiteSend (320k USD). Further spending focused on integrating numerous exchanges, on/off-ramps, and other payment services to the Polkadot Hub. Expanding the NFT ecosystem (2m USD) included the Hub integration of Kodadot (870k USD), NFT interoperability in the ecosystem through NFT XCM (730k USD), and event experience DOTphin (330k USD). OpenGov is experimenting with new Governance (1.8m USD) protocols by funding a Futarchy proposal (1m USD) and Project Glove for more anonymity in voting (810k USD).
1.8m USD was spent on security audits for specific projects in the ecosystem. (We include them here, as we see them as a BD expense that is offered as a benefit to partnering projects.) 1.4m on further protocol development subsidies. The integration of the music industry is approached via Billfold (1.1m USD), and 760k USD go to onboard Government use cases for Mandala.
Economy

Economy (15.3m USD) consisted of DeFi incentives of 1m DOT each for Hydration and StellaSwap, to be given to liquidity providers of the protocols.
Talent & Education
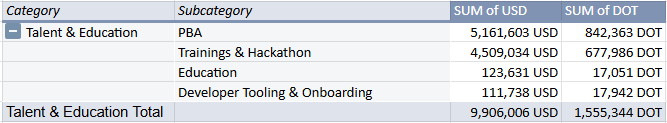
Talent & Education (9.9m USD) represents Polkadot's HR agenda. Educating hundreds of blockchain developers and founders each year is headlined by the Polkadot Blockchain Academy (5.1m USD). Trainings & Hackathons (4.5m USD) included EasyA (2.6m USD), a Dubai hackathon (1.2m USD), Encode Club (410k USD), and numerous individual ones. In the Education section (120k USD) two courses for Rust and Substrate and in Developer Tooling & Onboarding (110k USD) the Kudos initiative got funded.
Operations
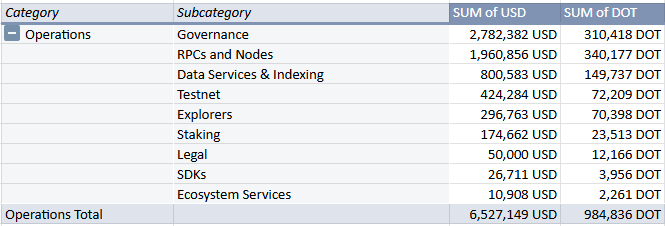
Operations (6.5m USD) covers software and hardware essential to operate the network. Governance (2.8m USD) consists of Polkassembly (1.8m USD), launching the Polkadot Community Foundation (640k USD), and contributions of JUST for various OpenGov operations (290k USD). RPCs and Nodes (2m USD) cover the operations of RPCs, collators, and archive nodes, primarily through the IBP bounty. Data Services & Indexing (800k USD) consists mostly of Subsquid public data indexes (770k USD). Infrastructure (390k USD) covers the operations of the Paseo testnet. Explorers (300k USD) mostly went towards Subscan (260k USD). Similarly, Staking (175k USD) runs the Polkadot Staking Dashboard (166k USD).
Research
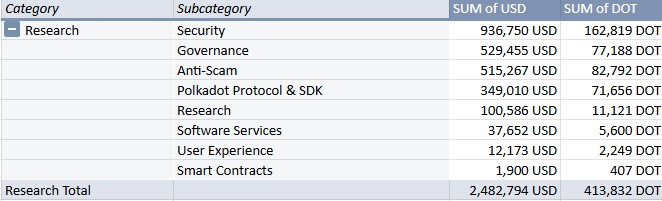
Research (2.5m USD) funds projects that are experimental. Security (940k USD) paid for audits to the StorageHub (390k USD) and ink! 5.0 (180k USD) code base. Under Governance (530k USD), OG Tracker was funded with 300k USD and the Polkadot Ecology Research Institute received 210k USD. Anti-Scam (510k USD) goes towards the Anti-Scam bounty, which takes down scam sites. Polkadot Protocol & SDK (350k USD) funded the Spammening (290k USD) and restaking research (63k USD).
Departments (Bounties & Collectives)
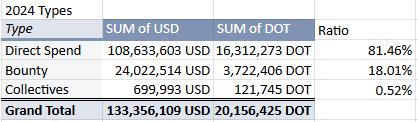
Departments, (sometimes also referred to as executive bodies) are subDAOs that are set up to develop a certain area of the ecosystem. They simplify OpenGov by taking care of a certain area, reducing mental load and volume on the general voting tracks. In the past year, Bounties have grown to be responsible for 18% of the spending. Collective spending has slowly trended up. Keep in mind that these costs were already represented in the previous chapters and this is just a different perspective to represent them.
We begin with bounties.
Bounties
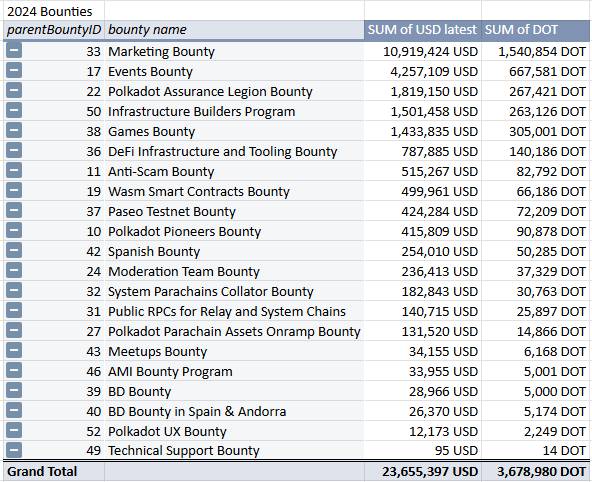
Bounties are similar to departments in traditional organizations. Bounties have a specific mandate to spend money to achieve certain goals. Collectively, Bounties spent 23.7m USD, 18% of the total expenses in 2024. On top, we have the Marketing (10.9m USD) and Events (4.3m USD) bounties, focusing on outreach. The Polkadot Assurance Legion provided security audits worth 1.8m USD. The Infrastructure Builders Program operates crucial node infrastructure, costing 1.5m USD in 2024. Then we have two business development bounties, Games (1.4m USD) and DeFi and Infrastructure (790k USD), working to bring more business in those areas to Polkadot.
Collectives
So far, only the Technical Fellowship received funds as a collective. The newly launched Ambassador program is currently running a trial run and will be formally established on-chain in 2025. For the technical Fellowship, the following salary costs have accrued:
- 2024-04: 16,670 USD
- 2024-05: 35,000 USD
- 2024-06: 51,253 USD
- 2024-07: 67,080 USD
- 2024-08: 71,670 USD
- 2024-09: 93,330 USD
- 2024-10: 87,080 USD
- 2024-11: 92,080 USD
- 2024-12: 92,080 USD
Discussion
In this chapter, we will zoom out and discuss the long-term trend.
- How was the Treasury doing overall in 2024 quantitatively and qualitatively?
- What is the 2025 perspective of the Polkadot Treasury?
Changed Inflation Dynamic
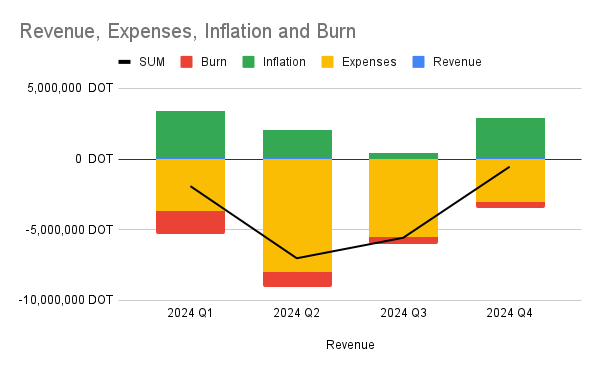
The most significant change to the cash flow of the Treasury has come from a new inflation model. Polkadot emissions have been reduced. Previously, they were 10% of the current supply, which resulted in an effective inflation of ~150m DOT in 2024. This model was now changed to be a constant 120m DOT per year, an effective inflation reduction of 20%. Of that inflation, 15% is directed towards the Treasury, leading to a fixed budget of 18m DOT per year going to the Treasury.
As you can see in the graphic above, the inflation change and better stakeholder alignment create a new environment towards the end of he year that stabilized the Treasury around 15m DOT in main account reserves.
This change has significantly changed the outlook of the Treasury, as we will see in this chapter. If spending and DOT price were the same as in 2024, reserves would deplete in only 10 years. This gives ample room and stability to invest in developer tooling, BD efforts, and other long-term initiatives.
Balance Sheet & Cash Development
How was the Treasury doing in 2024? In this chapter, we will look at the quantitative development.
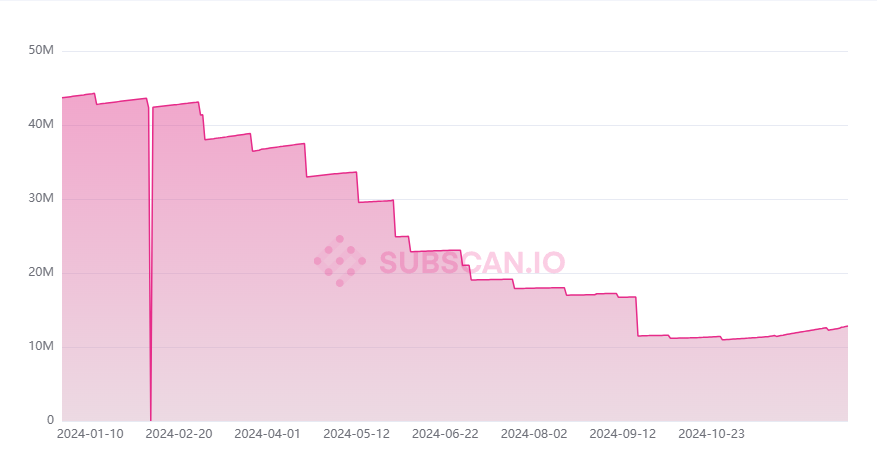
Balance Sheet
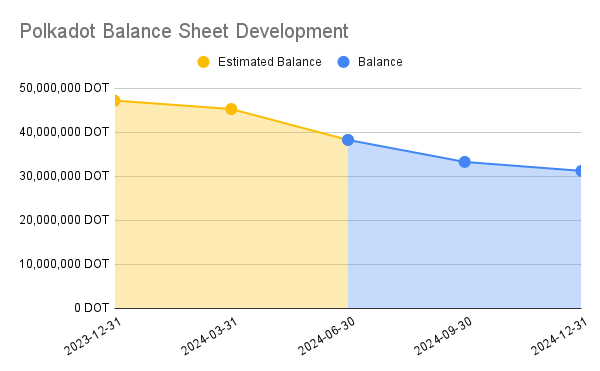
Looking at the development of the total balance of the Treasury, we can estimate that Polkadot started the year with ~48m DOT and ended with 31m DOT.
But not every part of the balance is freely spendable. Only the available cash can be freely spent.
Cash
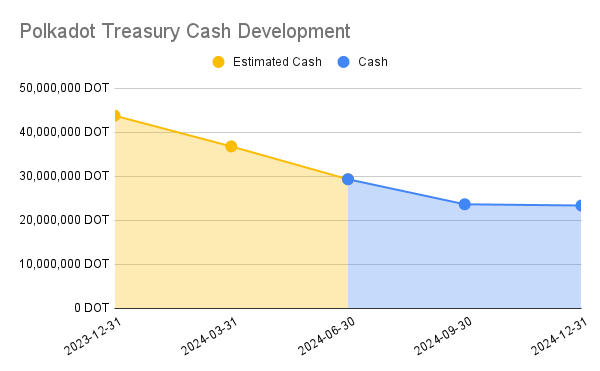
For Cash & Cash Equivalents, the year started with an estimated 44m DOT and ended with 23m DOT.
Overall, we learn that the Treasury shifted some of its balance sheet from free cash towards bounties and letting capital work in the economy. The freely available cash should receive special attention in the coming year.
Revenue, Expenses, Inflation, and Burn
-c69edacc557d0904d3e137e6733068d1.png)
Overall, the DAO has been spending more than it earned through inflation. These effects became less visible late in the year, as spending, in general, was slowing down, but also somewhat hidden by the fact that the available cash had been growing towards the end of the year, while bounties still kept spending, which is less visible to the average observer.
Unrealized Forex Losses
We observe that the Treasury holds unrealized Forex losses from buying USD stables at low DOT prices. We estimate that the net losses make up 1.6m DOT.
As a starting point, observe that the income statement shows a plus of 120k DOT from Q3 to Q4, but the balance sheet netted a minus of 2m DOT in the same timeframe. How is that possible? The difference lies in unrealized losses that are reflected on the balance sheet.
To understand this, consider that the Treasury is selling DOT to acquire USD stables. This makes sense in a downward momentum, where DOT is sold at a higher price and those stables are spent when DOT arrives at a lower price. However, the inverse is true when DOT is sold at a lower price and then the DOT price rises. In other words, the Treasury sold low.
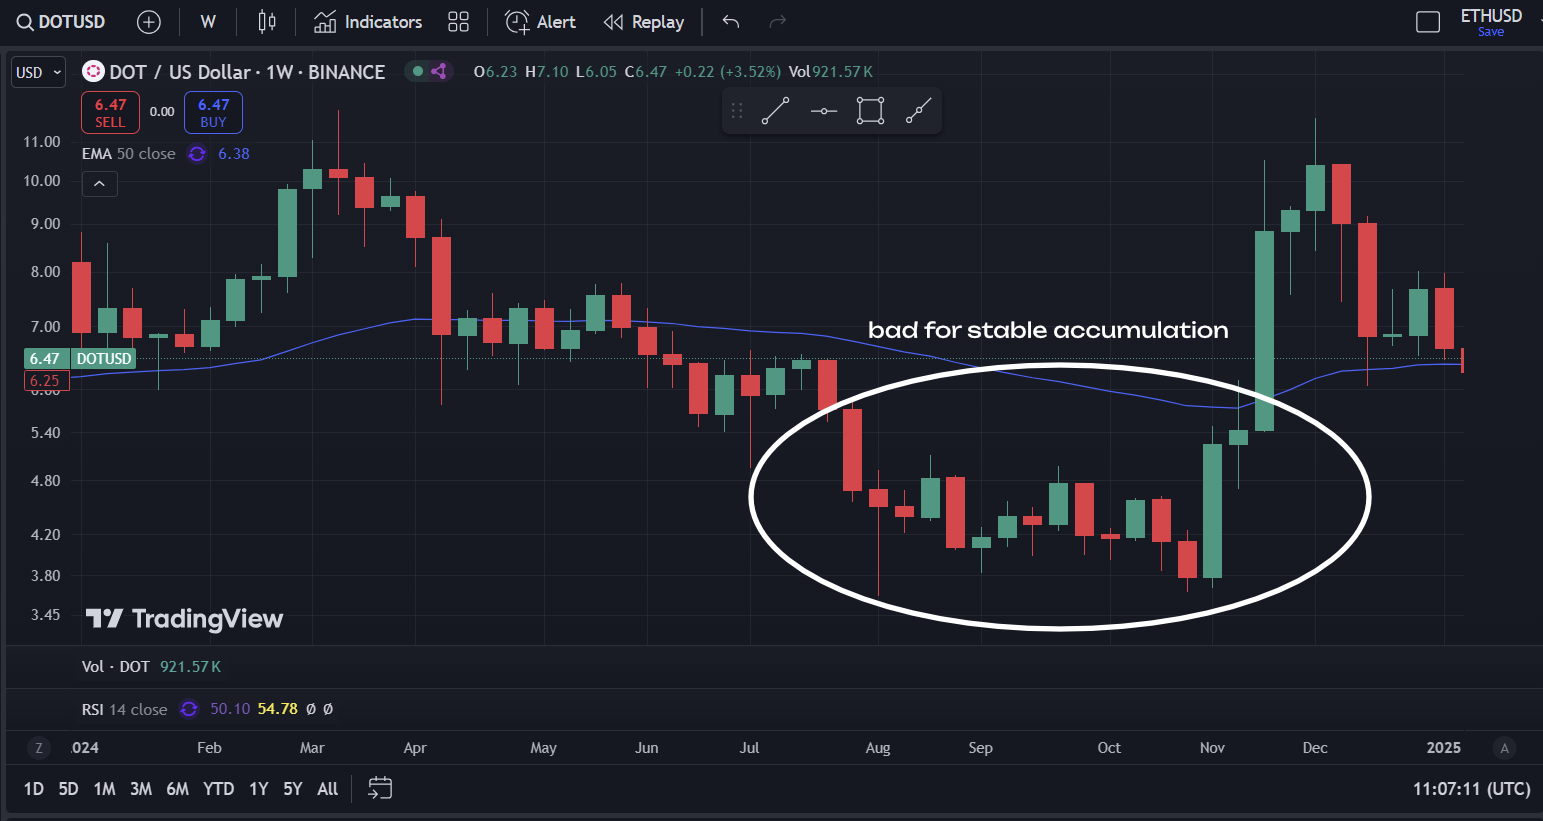
We estimate the Treasury made Forex earnings (realized and unrealized) of 570k DOT in Q3, while in Q4 losses of 2.15m DOT were incurred, totaling a net loss of 1.6m DOT.
However, the discussion around the topic is complex, since the Treasury cannot predict how the market will develop. A common argument is that relative losses might be bigger if DOT proposals are made and DOT price appreciates in the proposal period. We might be able to compare effects with more detailed simulations in future reports.
Qualitative Considerations
The DAO has developed considerably in 2024.
- Stablecoins were added
- Numerous executive bodies (bounties and collectives) were added, increasing the DAOs capacity to process proposals and make more intelligent decision
- More capital has been deployed into the market to support the DeFi ecosystem
Overall, the Treasury’s balance sheet is becoming more opinionated, earmarking money in advance for executive functions and deploying it into the market.
Projections
In this chapter, we want to ask what can be learned for 2025.
Projections about the future are hard to make, since the Treasury’s economy operates in DOT, while service providers typically use fiat like USD as the unit of account. Changing DOT prices and the new inflation model come into play.
The good news is that now for the first time, enough data has been gathered to make reasonable cost projections about the future.
Considering the changing DOT prices new Inflation Model
Polkadot introduced a new inflation model at the end of 2024 that will grant the Treasury 1.5m DOT per month, or 18m DOT per year. A perspective put forward by some is that these 18m DOT could be considered the budget, with the remaining Treasury balance as the strategic reserve.
Is past spending future spending?
133m USD (20m DOT) have been spent in 2024.
Some of these costs are more stable than others. Development and operations relate to the cost drivers of the core infrastructure, which are coupled with the network's overall capacity.
The other categories however are more elastic. An important observation from 2024 is that the ability to spend money meaningfully is tied to the amount of competent personnel the ecosystem can attract.
As an approach to budgeting the DAO’s money, stable costs could be denominated in USD, say ~6.5m USD are needed to operate the network, while elastic positions could be expressed in their relation to each other, such as the relation of Outreach to Business Development, and as such, DOT amounts could be considered to express the relative purchasing power of the network.
The discussion keeps evolving, but definitive answers are still not found.
Notes
- The raw data for this report can be found in the following places:
- Data Acquisition Methodology
- We extend our thanks to the Subsquare, the Parity data team, and lolmcshizz for providing valuable data and inputs for this report.
- Balance sheet values
- intra-day exchange rates for DOT and MYTH were retrieved on 2024-12-30 from Coingecko
- token holdings on accounts were retrieved via Subscan
- The DOT amount in the Hydration Omnipool is retrieved from the Hydration UI
- Outstanding wages payable are retrieved from the SubSquare collectives UI
- Bounty holdings are retrieved from SubSquare
- Income Statement
- Referenda and child bounties were fetched through Subsquare’s API. Code is here
- Determination of DOT and USD values
- We do deep inspection of calls to build a bag of different assets.
- For a given date, the bags value in DOT or USD equivalent is then calculated according to market rates at those days
- Bounty and XCM send values are assumed 0. Typically they just move DOT into designated accounts and later spending can then be recognized independently
- batch calls are traversed
- Determination of DOT and USD values
- Full bounty spend: Two instances in the relevant timeframe is recorded. These were manually taken from Subscan
- Collective spend DOT values are approximated by taking the DOTUSD price in the middle of the period.
- Inflation, Burn, Fees, and other values have been provided on a monthly basis by the Parity data team.
- To estimate Forex earnings/losses from T1 to T2, we calculated
-(BalanceT1 - BalanceT2+NetEarningsT2). We believe that this is the only explanation for the difference of a DOT balance. Since the balance is also calculated by calculating the DOT value of USD stables with the exchange rate on the day of the balance sheet, Any difference between the income statement and the balance sheet can be assumed to come from unrealized losses/earnings. - The Treasury got gifted several memecoins, which we currently do not consider sellable, thus valuing them 0.
- We use the following guiding principles to assign categories:
- Categories are assigned by where the primary effect of the spending will unfold its value. Titles and descriptions are less relevant here than the list of actual deliverables.
- We consider the perspective of the Polkadot ecosystem. Does it affect core technologies or is it application-specific?
- There are proposals that could belong to multiple categories. We choose the category where the majority of the costs go to.
- Referenda and child bounties were fetched through Subsquare’s API. Code is here
- The report uses a cash accounting (for the most part)
- This means that expenses and income are considered when money changes accounts, not when the actual service is delivered.
- We strive to arrive at accrual accounting, as it is more in line with international accounting practices. But we lack the necessary team capacity and data from spends and bounties.
- This can create distortions, for example when payments are made that extend over the measurement period, or when transactions (like the Myth swap or the Inter Miami deal) are prepaid but not yet executed (and might still fail and get refunded). Another example is the new spend() extrinsic, which we account for at the time of referendum execution.
- The current report bases its numbers on the execution date of proposals, which can deviate from the time tokens are spent. For past reporting, we only represented direct spending from the Treasury and it was convenient to represent them on the date of spending.
- Expenses
- Loans and liquidity provisions are not represented in the income statement, as they do not count as expenses per accounting standards. They will show up on the balance sheet
- Bounty creation & bounty refills are also hidden since these are not yet expended but rather become designated assets. Once they are spent via child bounties (or in a single instance fully), expenses are accounted.
- Refunds: We record income from transfers to the Treasury. These transactions are most likely refunds from OpenGov proposers that have been overpaid or decided not to deliver. However, tracking the origin of these transactions is out of the scope of this report.
- issues
- when a collective pays out tokens from their sub-treasury, no proper events for withdrawal and deposit are emitted - https://collectives-polkadot.subscan.io/extrinsic/4473407-2
- we can’t track bounty spends if the bounty decides to liquidate to fiat to retain value. this leads to a spend being recorded at the time of liquidation
- This report is created by humans and might contain errors. Don’t trust, verify.